Blogs
Road load data acquisition (RLDA) measures vehicle forces and responses under real-world driving conditions, helping engineers make informed durability and designWhat Does Road Load Data Acquisition Measure? A useful RLDA dataset pairs loads at the wheel or component with signals that show what the vehicle was doing at the same time. A wheel force transducer (WFT) replaces a standard wheel and measures forces and moments at the tire contact patch. Vehicle speed alone cannot stand in for the loads a component experiences. A WFT can capture three forces, Fx, Fy, and Fz, plus three moments, Mx, My, and Mz. It can also record wheel speed in RPM and wheel position in degrees. These channels help engineers connect wheel inputs with the vehicle’s response. The measurement plan can also track component loads and strain, along with acceleration, displacement, pressure, and temperature. Engineers may record chassis twist, engine behavior, or vehicle-bus data. GPS location and video add context about where an event occurred and what the vehicle encountered. Vehicle CAN channels can include speed, GPS location, accessory use, and door use. Together, these signals help explain whether a peak load came during braking, a turn, or another event. A clear test plan links each channel to the question it must answer. Wheel forces and moments Component strain and stress Accelerations and displacements Pressure and temperature Vehicle operating signals These measured groups serve different roles in acquisition. Wheel loads show inputs at the tire contact patch, while strain and stress help describe component response. Temperature and pressure can reveal changes that matter during sustained operation. GPS and video can place a measurement in its driving context. That context is useful when a vehicle repeats a route or when teams compare data from different tests. It also helps keep unusual events from being treated as typical use. Tie each sensor channel to the component and mounting location it represents. How Are Road Loads Captured on Roads and Test Tracks? A proving ground provides repeatable test conditions. However, public roads and in-service driving show how vehicles perform in real-world conditions. Therefore, engineers choose the testing location based on their goals, such as repeatability, real-world use, or both. Public Roads, Proving Grounds, and In-Service Driving Public roads expose vehicles to everyday road surfaces, traffic, and driving habits. For example, a planned route can include different road types. However, road conditions may change depending on the time and location. As a result, engineers can understand how vehicles respond during daily use. Proving grounds offer fixed road surfaces and driving conditions. Therefore, engineers can repeat the same tests and compare results more easily. In addition, they can perform similar tests on different vehicles or after making design changes. In-service monitoring records how vehicles are used over a longer period. For example, data collection can last from a few days to two years when engineers need to study seasonal changes. Both petrol and diesel vehicles, as well as electric vehicles, can be equipped with sensors for this testing. Each testing method serves a different purpose. While short testing programs focus on specific driving events, longer monitoring helps engineers understand changes in vehicle use across different seasons. Therefore, the selected route and vehicle conditions should match the type of vehicles the test aims to represent. Coastdown tests and road-load coefficients A coastdown test characterizes road load as a force-versus-speed curve, often written as F0 + F1V + F2V2. Here, V means vehicle velocity. The fitted coefficients describe how force changes with speed during the coastdown analysis. Major contributors include aerodynamic losses, tire rolling losses, driveline losses, brake drag, and wheel-bearing friction. These sources act together in the measured result. The coefficients should not be assigned one-to-one to individual loss sources. Transmission behavior can affect all three fitted coefficients, which makes simple attribution unreliable. A team that treats one coefficient as a direct measure of one part may misread the vehicle’s total road load. The full drivetrain behavior matters when interpreting the curve. Coastdown results also depend on test conditions. An analysis of more than 100 tests from almost 30 vehicles across multiple segments examined ambient temperature and variation between tests. That variation matters when teams compare results from different conditions. Rolling resistance and aerodynamic drag affect emissions and fuel economy. Coastdown testing gives a real-world measure of these road-load parameters. The coastdown test analysis also examines how ambient temperature relates to test-to-test variation. Choose an in-service monitoring period long enough to include the seasonal effect the test is meant to capture. Which Sensors and Data Acquisition Systems Do You Need? Choose instrumentation from the engineering decision the test must support, then check that the DAQ system can acquire every selected channel together. Match each sensor to a physical quantity and a location before the vehicle leaves for testing. Matching sensors to the measurement objective A WFT measures forces and moments where the tire meets the road, with data captured at the wheel and vehicle hub interface. Strain gauges measure strain on selected components. Engineers use those readings to assess how parts respond to applied loads. Accelerometers capture motion and vibration, while displacement sensors track movement between points. Pressure sensors measure fluid or air pressure. Temperature sensors track heat at components or within the vehicle. GPS records position, and vehicle-bus inputs provide operating signals such as speed or system status. A measurement plan may also include wheel-end and body movement, component strain, and vehicle speed. Sensor placement should reflect the component and response under study. Synchronizing and checking the DAQ system A data acquisition system records signals such as speed, acceleration, force, torque, and pressure. Measurements can only be compared when wheel-end, body, analog, and vehicle signals share a time base. Without that alignment, teams may link a load peak to the wrong vehicle event. Channel capacity is a planning issue, not a fixed number to guess. The system needs enough inputs for the selected sensors, vehicle-bus data, GPS, and any other recorded channels. Teams should also plan for the
+ Read More
A lane change test is a controlled vehicle testing procedure used to evaluate stability, handling and steering response during sudden manoeuvres. During the test, a vehicle follows a cone-marked course, moving from its original lane into an adjacent lane and returning as specified by the test procedure. The results help engineers assess how the vehicle responds to rapid steering inputs, changes in direction and potential emergency manoeuvres. This type of vehicle stability testing supports vehicle development and handling assessment under controlled conditions. Unlike a driving licence road test, an engineering lane change test focuses on vehicle behaviour rather than the driver’s general road skills. Key Takeaways Engineers assess vehicle response during a controlled, sudden lane change. The test driver follows a cone-marked lane-change track. Vehicle setup, track conditions and loading affect the test. Clearing the cones does not alone settle the handling assessment. Requirements depend on the procedure and authority that apply. The purpose is to assess the vehicle, not to judge a driver’s license skills. The course layout and test conditions determine how that assessment can be carried out and compared. How Does the Lane Change Test Evaluate Vehicle Stability? The engineering test evaluates a vehicle’s response to a rapid, controlled lane change, not a driver’s license eligibility. A test driver negotiates a set course under qualified test oversight, while a road test assesses how a person drives. Engineering assessment versus a road test A road test looks at the driver’s choices and skills on public roads. An engineering lane change test instead studies how the vehicle responds when the driver follows a defined path. The test driver is not making ordinary traffic decisions during the run. The driver steers through a marked lane, moves into an adjacent lane, and returns as the procedure directs. One light-vehicle procedure applies to vehicles with a gross vehicle mass up to and including 3,500 kg. Its assessment is subjective and considers road-holding ability and handling during an emergency lane-change manoeuvre. That scope describes one procedure, not a universal Indian approval rule. Indian approval or certification requirements depend on the applicable authority and protocol. What Vehicle Behaviour Can the Manoeuvre Reveal? A quick steering input can show whether the vehicle follows the intended path or moves wide. It can also expose body roll, delayed response, or a loss of stable control. A vehicle lane change test helps engineers examine how steering response, suspension behaviour, tyre grip and vehicle loading influence handling during a sudden change of direction. Vehicle behaviour depends on the whole system, including tyres, suspension, steering, loading and stability controls. A test can help engineers assess how those parts work together during the change. How Is the Cone Track Laid Out? The lane-change track is a cone-marked route that leaves the starting lane, crosses to a parallel lane and returns. Its six sections use widths based on the vehicle, so the path scales with the vehicle being tested. Cones mark the boundaries of the path. The test driver first steers away from the initial lane, follows the offset route, then moves back toward the original lane. One procedure divides the course into six sections. Each section has a set length and a width tied to vehicle width plus 0.25 m. Track sections Combinedv section lengths Section width 1-2 15 m + 30 m 1.1 × vehicle width + 0.25 m 3-4 25 m + 25 m 1.2 × vehicle width + 0.25 m 5-6 15 m + 15 m 1.3 × vehicle width + 0.25 m For these calculations, vehicle width excludes rearview mirrors. The lane offset is 3.5 m, which sets the lateral distance between the two parallel lanes. Track limits run tangentially to the cones’ base circles. In practical terms, the boundary follows the outer edge of each cone base, rather than the cone’s center. The six sections create a route with a clear entry, two lane changes and a return. Their changing widths give the test driver room that matches the course design. That geometry only supports fair comparison when the track and environmental conditions are controlled. The surface, weather and measurement setup also shape each run. What Conditions Keep Results Comparable? A repeatable course requires more than correctly spaced cones. The surface, slope and wind must stay within set limits so the vehicle faces comparable conditions during testing. Track surface and weather controls The specified track is sealed, dry, hard and as planar as possible. Its skid number must be at least 70 under ASTM, a measure of surface grip. The longitudinal slope must not exceed 1 degree. The transverse slope must not exceed 2 degrees, and wind speed must stay at or below 3 m/s, or 11 km/h. These limits reduce outside effects on steering and vehicle movement. A slope can pull a vehicle toward one side, while wind can affect its path during a fast change. Speed measurement also uses a defined distance. The average-speed distance runs from the start of section 1 to the end of section 5. Position and vehicle-dynamics measurements Extra measurement channels can help explain what happened between course entry and exit. Common groups include: GNSS position and velocity. Inertial data, such as roll, yaw angular velocity and lateral acceleration. CAN data, including engine RPM and steering angle. GNSS means satellite-based positioning, while CAN is the vehicle network that shares data among electronic systems. These signals add detail beyond a visual record of the run. Comparing speed or lateral position against distance can show how the vehicle tracked through the course. A sudden position change may help explain a wide path or a correction by the driver. Measurements do not replace the required protocol. They add information for engineers, while the procedure still sets the conditions used to judge a valid test. With the track and environment controlled, attention turns to the vehicle’s condition and equipment before it enters the course. How Is the Vehicle Prepared Before Testing? Vehicle test tare mass is the vehicle’s prepared, unloaded mass after specified
+ Read More
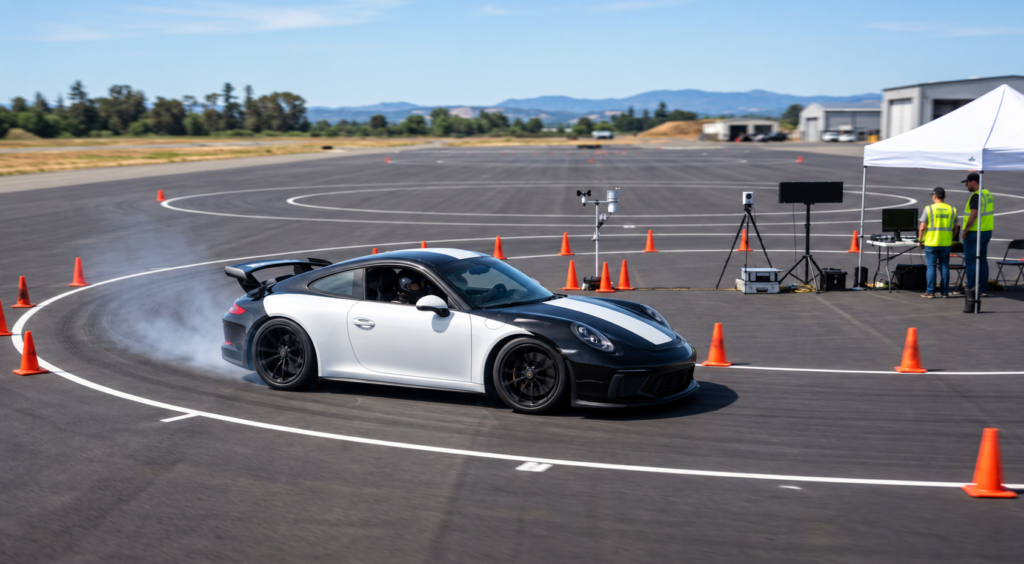
Engineers rely on the skidpad test in Pune to assess vehicle control during sustained sideways force. By driving in a constant circle, experts conduct a vehicle cornering test to measure the maximum lateral acceleration before the car loses traction. This process reveals a vehicle’s overall grip, balance, and mechanical stability, making it an important automotive handling test for evaluating vehicle dynamics. For drivers in India, skidpad test results help them make informed vehicle safety decisions. However, controlled track results cannot fully match unpredictable public roads. Heavy monsoon conditions, erratic traffic, and poor road surfaces create challenges beyond simple laboratory measurements. Key Takeaways The procedure measures lateral acceleration to determine how well a car handles corners. Performance data highlights the relationship between tire grip and chassis balance. Controlled environments provide a baseline for comparing vehicle stability across different models. Track results serve as a guide but do not account for real-world hazards like monsoon rain. Drivers should balance technical specifications with the realities of daily commuting in India. What a Skidpad Test Measures Understanding a skidpad test shows how engineers measure a car’s true cornering ability. This vehicle cornering test creates a controlled setting for finding the limits of the chassis and tires. Engineers use a fixed path so each run stays consistent and easy to compare. How a Constant-Radius Circle Reveals Cornering Performance The test requires driving around a perfect circle with a known radius. The fixed radius lets the driver focus on steady speed near the tires’ grip limit. This design removes road variables and supports precise data collection. The Relationship Between Lateral Acceleration and Grip Engineers calculate lateral acceleration with the formula a = v²/r, where v represents velocity and r is the circle’s radius. As speed rises, the force on the tires grows quickly. This measure shows how much grip the tires provide before losing traction. Why Stability Matters Alongside Maximum Cornering Speed A high-performance vehicle stability test must examine a car at its limit, not only its top speed. A fast but unpredictable car is hard for a driver to control safely. Engineers seek balance, even as the tires begin to slide. Understeer, oversteer and neutral handling behavior Handling types show how a vehicle responds to steering during a turn. Understeer occurs when the front tires lose grip, so the car pushes wide of its intended path. Oversteer occurs when the rear tires lose grip, so the tail swings outward. A neutral setup follows the steering angle without excessive front or rear sliding. Handling Type Front Tire Behavior Rear Tire Behavior Driver Experience Understeer Loss of traction Maintains grip Car pushes wide Oversteer Maintains grip Loss of traction Tail swings out Neutral Balanced grip Balanced grip Predictable turn How Engineers Set Up a Vehicle Cornering Test The vehicle cornering test requires careful preparation and a controlled environment. Engineers must remove variables that could distort data, so measurements show the automobile’s true mechanical limits. Choosing the Skidpad Surface and Circular Layout The test needs a perfectly flat, circular track with a set radius. Engineers usually choose smooth asphalt or concrete because these high-friction surfaces provide steady grip. A uniform surface keeps bumps or debris from upsetting the vehicle’s balance. A constant radius lets the team study lateral acceleration as the main variable. Preparing Tyres, Pressures, Suspension and Vehicle Load Before the vehicle handling test begins, engineers set the car to a specific baseline configuration. They check that tyre pressures match the manufacturer’s recommendations for high-performance driving. Engineers also measure the vehicle’s total mass, including fuel, passengers, and cargo. Even small changes in suspension geometry or ride height can greatly change weight distribution during a turn. Using Cones, Data Acquisition Systems and Safety Equipment Engineers place markers around the circle to guide a precise line. These visual aids keep the driver on the intended path while specialized hardware records performance data. Data loggers to capture real-time G-force and speed. High-visibility cones to define the circular boundary. Safety gear, including fire extinguishers and emergency medical support. Controlling temperature, wind and surface conditions Environmental factors strongly affect a vehicle cornering test. High temperatures can soften tyre compounds, while strong winds may push the vehicle from its ideal line. Engineers often check the surface for dust or moisture that could reduce traction. Stable conditions help them gather repeatable data across testing sessions. Repeating runs to improve test consistency One pass rarely validates a vehicle handling test. Teams make multiple laps clockwise and counter-clockwise to account for track banking or driver bias. By averaging several runs, engineers can filter out unusual results. This careful process makes the final figures reliable, objective, and representative of the vehicle’s actual capabilities. How the Skidpad Test Is Conducted A skidpad test uses controlled maneuvers to push a vehicle toward its handling limits. Engineers follow strict, repeatable steps to measure lateral grip and overall stability. Entering the Circle and Building Up Cornering Speed The driver enters the circular track at a low, steady speed. After the vehicle settles on the correct radius, the driver slowly adds throttle to build lateral acceleration. Gradual inputs are essential for keeping the vehicle balanced during this transition. Maintaining a Consistent Driving Line and Throttle Input Consistency creates reliable skidpad test results. The driver holds a precise line, keeping the tires on the painted circle or marked path. Erratic steering or sudden throttle changes can distort the final performance measurements. Maintain a constant steering angle to keep the radius fixed. Apply throttle smoothly to avoid upsetting the chassis balance. Focus on visual markers to ensure the vehicle stays centered. Recording Multiple Laps in Both Directions To account for track banking or wind, the test runs clockwise and counter-clockwise. Averaging these results shows the vehicle’s true capabilities. This practice reduces the driver’s influence on the final data. Managing tyre slip without leaving the test path As speed rises, the tires naturally begin to lose traction. The driver manages this slip angle with small steering and throttle adjustments. Staying within the test path
+ Read More
Explore the Future of EV Homologation in India (2026), explaining key regulatory changes and their impact on the automotive industry.
EU Homologation vs Indian Type Approval explained: Learn essential differences for vehicle certification and regulatory compliance in India.
NpElectronics provides top-tier ADAS testing equipment suppliers in Pune, India. Elevate your autonomous driving development with our innovative solutions.
Discover the importance and applications of a brake tester with NP Electronics. Our reliable brake testing solutions ensure safety and compliance.
Discover the vehicle coast down test procedure in Pune with NP Electronics. Optimize your vehicle’s performance and efficiency.
Ensure accurate vehicle speed with our professional Speedometer Calibration Services. Trusted by drivers in India for reliable speed testing.
Ensure safety and performance with our top-of-the-line automotive brake testing equipment. Trusted by mechanics and technicians.