
Road Load Data Acquisition: Testing Methods Explained
Road load data acquisition (RLDA) measures vehicle forces and responses under real-world driving conditions, helping engineers make informed durability and designWhat Does Road Load Data Acquisition Measure?
A useful RLDA dataset pairs loads at the wheel or component with signals that show what the vehicle was doing at the same time. A wheel force transducer (WFT) replaces a standard wheel and measures forces and moments at the tire contact patch. Vehicle speed alone cannot stand in for the loads a component experiences.
A WFT can capture three forces, Fx, Fy, and Fz, plus three moments, Mx, My, and Mz. It can also record wheel speed in RPM and wheel position in degrees. These channels help engineers connect wheel inputs with the vehicle’s response.
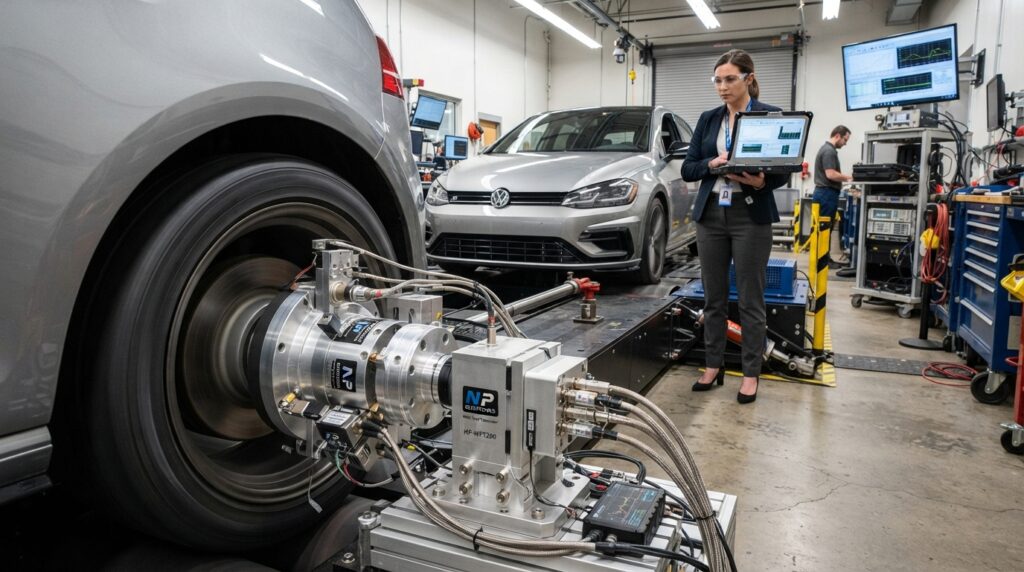
The measurement plan can also track component loads and strain, along with acceleration, displacement, pressure, and temperature. Engineers may record chassis twist, engine behavior, or vehicle-bus data. GPS location and video add context about where an event occurred and what the vehicle encountered.
Vehicle CAN channels can include speed, GPS location, accessory use, and door use. Together, these signals help explain whether a peak load came during braking, a turn, or another event. A clear test plan links each channel to the question it must answer.
- Wheel forces and moments
- Component strain and stress
- Accelerations and displacements
- Pressure and temperature
- Vehicle operating signals
These measured groups serve different roles in acquisition. Wheel loads show inputs at the tire contact patch, while strain and stress help describe component response. Temperature and pressure can reveal changes that matter during sustained operation.
GPS and video can place a measurement in its driving context. That context is useful when a vehicle repeats a route or when teams compare data from different tests. It also helps keep unusual events from being treated as typical use.
Tie each sensor channel to the component and mounting location it represents.
How Are Road Loads Captured on Roads and Test Tracks?
A proving ground provides repeatable test conditions. However, public roads and in-service driving show how vehicles perform in real-world conditions. Therefore, engineers choose the testing location based on their goals, such as repeatability, real-world use, or both.
Public Roads, Proving Grounds, and In-Service Driving
Public roads expose vehicles to everyday road surfaces, traffic, and driving habits. For example, a planned route can include different road types. However, road conditions may change depending on the time and location. As a result, engineers can understand how vehicles respond during daily use.
Proving grounds offer fixed road surfaces and driving conditions. Therefore, engineers can repeat the same tests and compare results more easily. In addition, they can perform similar tests on different vehicles or after making design changes.
In-service monitoring records how vehicles are used over a longer period. For example, data collection can last from a few days to two years when engineers need to study seasonal changes. Both petrol and diesel vehicles, as well as electric vehicles, can be equipped with sensors for this testing.
Each testing method serves a different purpose. While short testing programs focus on specific driving events, longer monitoring helps engineers understand changes in vehicle use across different seasons. Therefore, the selected route and vehicle conditions should match the type of vehicles the test aims to represent.
Coastdown tests and road-load coefficients
A coastdown test characterizes road load as a force-versus-speed curve, often written as F0 + F1V + F2V2. Here, V means vehicle velocity. The fitted coefficients describe how force changes with speed during the coastdown analysis.
Major contributors include aerodynamic losses, tire rolling losses, driveline losses, brake drag, and wheel-bearing friction. These sources act together in the measured result. The coefficients should not be assigned one-to-one to individual loss sources.
Transmission behavior can affect all three fitted coefficients, which makes simple attribution unreliable. A team that treats one coefficient as a direct measure of one part may misread the vehicle’s total road load. The full drivetrain behavior matters when interpreting the curve.
Coastdown results also depend on test conditions. An analysis of more than 100 tests from almost 30 vehicles across multiple segments examined ambient temperature and variation between tests. That variation matters when teams compare results from different conditions.
Rolling resistance and aerodynamic drag affect emissions and fuel economy. Coastdown testing gives a real-world measure of these road-load parameters. The coastdown test analysis also examines how ambient temperature relates to test-to-test variation.
Choose an in-service monitoring period long enough to include the seasonal effect the test is meant to capture.
Which Sensors and Data Acquisition Systems Do You Need?
Choose instrumentation from the engineering decision the test must support, then check that the DAQ system can acquire every selected channel together. Match each sensor to a physical quantity and a location before the vehicle leaves for testing.
Matching sensors to the measurement objective
A WFT measures forces and moments where the tire meets the road, with data captured at the wheel and vehicle hub interface. Strain gauges measure strain on selected components. Engineers use those readings to assess how parts respond to applied loads.
Accelerometers capture motion and vibration, while displacement sensors track movement between points. Pressure sensors measure fluid or air pressure. Temperature sensors track heat at components or within the vehicle.
GPS records position, and vehicle-bus inputs provide operating signals such as speed or system status. A measurement plan may also include wheel-end and body movement, component strain, and vehicle speed. Sensor placement should reflect the component and response under study.
Synchronizing and checking the DAQ system
A data acquisition system records signals such as speed, acceleration, force, torque, and pressure. Measurements can only be compared when wheel-end, body, analog, and vehicle signals share a time base. Without that alignment, teams may link a load peak to the wrong vehicle event.
Channel capacity is a planning issue, not a fixed number to guess. The system needs enough inputs for the selected sensors, vehicle-bus data, GPS, and any other recorded channels. Teams should also plan for the signals they need to view together during analysis.
Calibration must cover more than static forces. Measurement accuracy depends on calibration for rotating-wheel forces and moments, as well as wheel angle and angle velocity. A setup that checks static loads but skips rotation-related calibration can distort wheel-end results.
Before each run, teams should confirm that the DAQ system records the intended channels and that each signal has a usable time reference. A brief check can expose missing inputs or timing problems before a long road session. The data is only useful if the recorded channels match the test plan.
The wheel force transducer calibration includes forces and moments on the rotating wheel, plus wheel angle and angle velocity. Those checks support accurate load readings at the wheel interface.
Verify zero, sensitivity and rotation-related calibration before interpreting wheel-end peaks.
How Does RLDA Data Support Durability and Approval?
RLDA results become most useful when the same measured loads can guide both a durability decision and a repeatable laboratory test. Recorded track forces can be reproduced on simulation rigs, while component strain and temperature can check finite element analysis.
Real-road measurements help engineers set up computer-aided engineering (CAE), laboratory simulation, and component fatigue tests. CAE can help assess how a design responds to loads. A test rig can then reproduce selected forces for repeatable lab work.
Strain and temperature readings from instrumented parts serve a different purpose. Teams can compare those measurements with finite element analysis to check whether its model reflects component behavior. This is not the same as replaying wheel forces on a rig.
A 2023 SAE study compared an Adams/Car model with measurements from an SUV fitted with six-axis WFTs and accelerometers. The results showed good agreement. Misuse driving raised most loads, including a 5.4-fold increase in longitudinal wheel-center force compared with durability driving, as reported in the SAE impact-road simulation study.
- Define the component, load case, and decision the test must support.
- Instrument the vehicle and parts for the selected measurements.
- Record vehicle response under the planned driving conditions.
- Process and report the data for CAE, lab tests, and review.
Those steps keep the test goal connected to the data used downstream. A report should identify the vehicle setup and conditions so another team can judge whether the measurements fit its work. The same care supports comparisons between vehicle testing and lab simulation.
| Setting | Test condition | Input captured or reproduced | Downstream use |
|---|---|---|---|
| Public roads | Real-use driving | Vehicle response and market conditions | Use-pattern evidence |
| Proving grounds | Specified driving profiles | Measured loads | Repeatable vehicle testing |
| Simulators | Laboratory test setup | Reproduced recorded forces | Component durability testing |
In India, AIS 175 is the identified standard for the Worldwide harmonized Light vehicles Test Procedure (WLTP). AIS 175 for WLTP sits within a broader vehicle type-approval process, not in place of it.
Type approval includes document scrutiny, vehicle tests, verification against AIS/IS standards, report scrutiny, and preparation of a CMVR certificate. RLDA data can inform engineering and testing, but it does not grant vehicle type approval by itself. Approval rests on the full process and its required checks.
Keep the vehicle configuration and test conditions attached to every dataset shared with another team.
Conclusion
The value of an RLDA campaign rests on whether its measurements answer a defined vehicle durability question. Clear test goals help teams choose useful conditions and build a measurement plan that keeps loads tied to vehicle operation.
That link matters when data moves into CAE, fatigue work, or durability testing. A load trace without its operating context can be hard to apply to another design or test. Teams should preserve the vehicle setup alongside each record.
Start by writing down the component or design decision the test must support. Then identify the channels and conditions needed to answer it. Start by writing down the component decision the dataset must support, then choose the test conditions and measurement channels around that decision.
About
NPElectronics is a Pune-based automotive engineering and consultancy company specializing in vehicle testing, data acquisition, performance evaluation, and automotive homologation services. The company provides technical solutions for two-wheelers, three-wheelers, passenger vehicles, commercial vehicles, electric vehicles, tractors, and other automotive segments.
With expertise in automotive testing and validation, NPElectronics offers services such as Road Load Data Acquisition (RLDA), Vehicle Performance Consultancy, Automotive Prototyping, EV Homologation, CMVR Certification, and Vehicle Performance Benchmarking. Its solutions help automotive manufacturers and OEMs evaluate vehicle performance, understand real-world operating conditions, and improve vehicle reliability and durability.
NPElectronics supports automotive businesses with specialized testing solutions and engineering expertise to meet industry requirements and vehicle development objectives.
 Previous Post